
In this project I explore the data from one of my favorite sports basketball.
The game changes so often from year to year so I decided to focus the stats from this millenia.
Intent
The intent with this project was originally to see if we could scrape accurate NBA stats from the internet.
From that point with the data coming in fairly clean we made sure there weren't any null values that could hinder our analysis.
Some of the questions I wanted answered were:
How does the game change from Regular Season to Playoffs?
- What stats are most highly correlated with each other?
- How are Minutes distributed between the Regular Season and Playoffs?
- How are Points distributed between the Regular Season and Playoffs?
- What are the changes in stats per 48 minutes from Regular Season to Playoffs?
- Finding league leaders in PPG increase from Regular Season to Playoffs?
- Teams with the most amount of Free Throws?
- Who are the free throw "merchants" of the league?

What stats are most highly correlated with each other?
When exploring correlations between basketball statistics, some results appear obvious to regular fans of the game. It's clear that there are positive correlations between offensive rebounds, defensive rebounds, and overall rebounds. Similarly, we observe a positive correlation between points and field goal makes and attempts, which is also logical. It was satisfying to find that players with more blocks tend to have a negative correlation with assists. This aligns with the general trend of big men having lower assist numbers but higher block numbers.

Minute distribution Regular vs Playoffs
Upon analyzing minute distributions, it becomes evident that there is a noticeable shift in how minutes are allocated between the regular season and the playoffs. In the regular season, the data exhibits a more normalized distribution, resembling a bell curve. However, as the postseason approaches, rotations tend to become tighter, resulting in a shift in the distribution. We observe a higher percentage of players either playing fewer or more minutes compared to the regular season.

Points distribution Regular vs Playoffs
When examining the distribution of points among players in both the regular season and playoffs, one would anticipate a similar pattern. Upon comparing the data, it becomes evident that the playoffs validate the notion that lineups and shot attempts become more concentrated. This is demonstrated by a higher number of players scoring fewer points in the playoffs compared to the regular season.

Per 48 Changes Regular to Playoffs
When analyzing team statistics per 48 minutes and accounting for the presence of 5 players on the court at any given time, I aimed to observe the changes in stats league-wide during the transition from the regular season to the playoffs. After graphing the data, my focus narrowed down to two specific stats: 3-point field goal attempts and free throw attempts. These particular statistics present a contrasting narrative to conventional wisdom. Firstly, despite the perception that the 3-point shot has only recently become significant in today's game, the data reveals its substantial role in playoff basketball over a considerable period. Secondly, contradicting the notion that referees tend to overlook fouls in the playoffs, the data suggests that they actually award more free throw attempts as the game becomes more physical in the postseason.

Leaders in PPG increases Regular to Playoffs
Upon examining the statistics at a league-wide level, I decided to delve deeper into player-to-player analysis. In particular, I focused on the changes that occur when players transition into the playoffs. My aim was to identify the players who experience the most significant increase in points per game during the postseason. Often, players acquire iconic monikers such as "Playoff Rando" or "Playoff Jimmy," from their increased performance in the playoffs. However, the surprising revelation from the data is that "Bubble Murray" emerges as the genuine playoff performer of the past two decades, boasting a remarkable 8.5-point increase in points per game.

Teams with the most amount of Free Throws
Returning to a broader perspective, I had a simple query to compare teams. As a devoted NBA fan from a small town myself, I was curious about one thing: Do big market teams receive favorable treatment from referees? To my disappointment, the data I examined provided inconclusive results on this matter. For example, it was quite surprising to discover that the LA Clippers, being the smaller of the two LA teams, ranked first in total free throws. However, this could be attributed to factors such as their style of play during the "Lob City" era. On a lighter note, it is amusing to observe that all the teams LeBron James has played for made it into the top 10... of course, I say this with a touch of humor and without any bias as a Pistons fan.

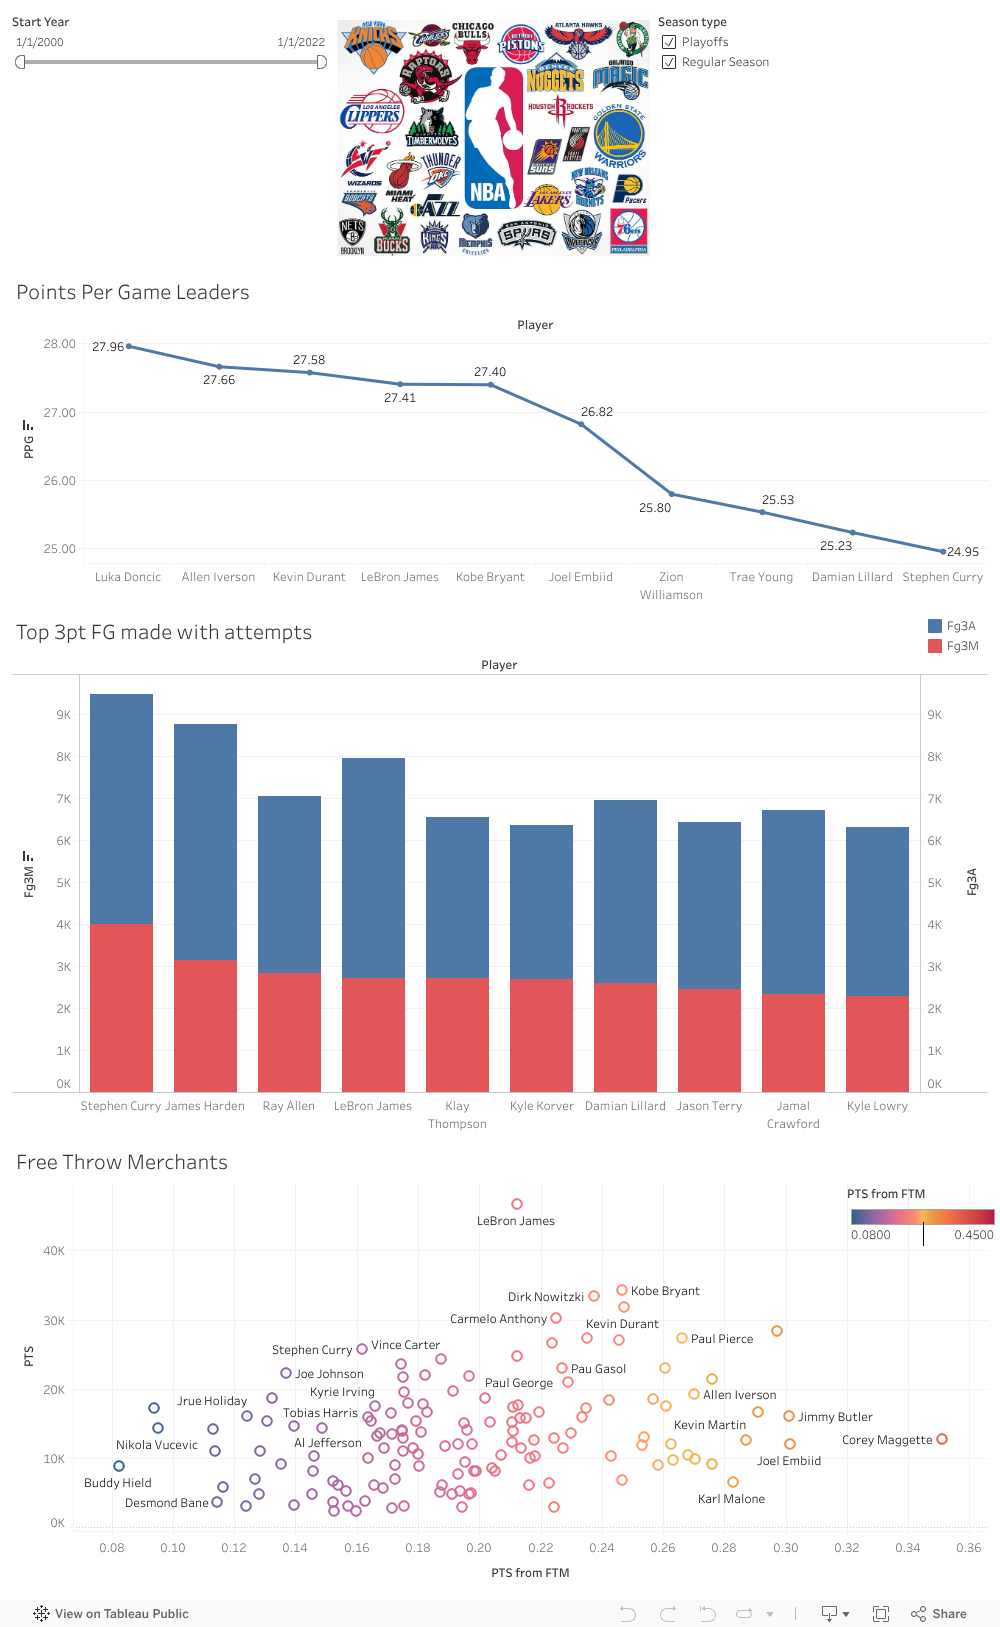
Free Throw Merchants
For my final analysis, I decided to identify the players who rely heavily on free throws for scoring by calculating the percentage of their points that come from free throws. Below, I'll provide the dashboard for others to explore further. Unsurprisingly, familiar names like James Harden, Joel Embiid, and Jimmy Butler emerged as the prominent "Free Throw Merchants," leading the pack in this category.
Tableau Dashboard
How has the League Changed?
Upon completing my analysis, it is evident that the NBA has undergone
significant changes over the years, marked by an increase in three-point
attempts and a surprising decrease in free throws. These findings challenge
common beliefs about the league becoming "soft." Contrary to popular perception,
the playoff data reveals a consistent upward trend in three-point shooting,
suggesting its significance in postseason play. Additionally, the data refutes
the notion that referees refrain from making foul calls during the playoffs, as
free throw attempts actually increase.
Another noteworthy observation is the shift in lineups during the playoffs,
with teams tightening rotations and focusing on their best players for shot attempts.
As the league embraces data-driven approaches to enhance efficiency, it will be
intriguing to witness the evolution of future basketball players and the construction
of championship teams. I intend to further explore this data in the future,
and you are welcome to follow the provided links to access the source code and
experiment with the interactive dashboard.